City in Richland County, Illinois
Olney
Who lives in Olney
Census survey estimates for 2020 to 2024, rounded.
People
- Population
- 8,600
- Median age
- 41.0 years
- Under 18
- 24%
- 65 and over
- 22%
- Veterans, of adults
- 9%
- Speak another language at home
- 3%
Race and ethnicity
- Hispanic or Latino, of any race
- 3%
- White, not Hispanic
- 92%
- Black, not Hispanic
- 1%
- Asian, not Hispanic
- 1%
Income and housing
- Median household income
- $60,000
- Below the poverty line
- 14%
- Bachelor's or higher, adults 25+
- 21%
- Owner-occupied homes
- 65%
- Median home value
- $100,000
2024 vote for president
Not counted for Olney on its own: its precincts follow township lines, not the town’s. See the figure for Richland County.
Who represents Olney
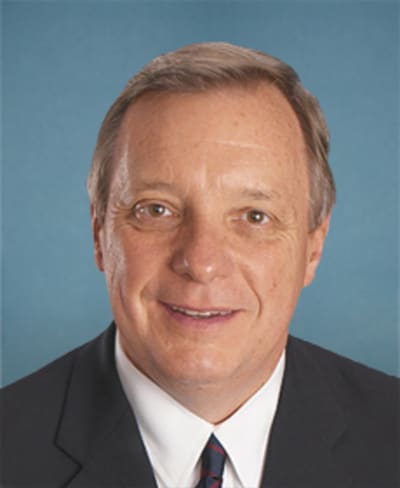
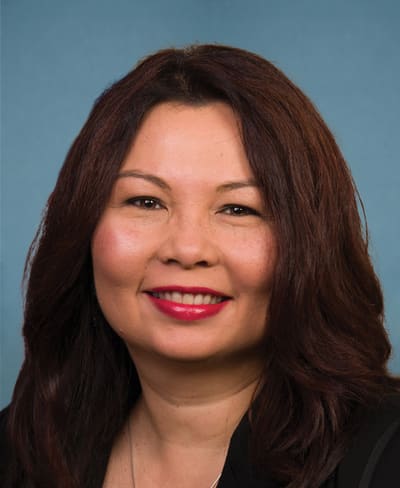
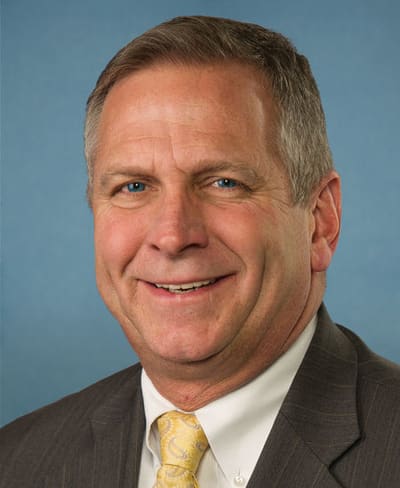
Olney's districts
U.S. House District 12
All of Olney
Held by Mike Bost, Republican
- Washington office: (202) 225-5661
About 746,800 people, median household income $68,500.
Largest towns: O'Fallon (part), Carbondale, Marion and 281 more
Illinois Senate District 55
All of Olney
Held by Jason Plummer, Republican
- Springfield office: (217) 782-5755
- District office: (618) 283-3000
Illinois House District 110
All of Olney
Held by Blaine Wilhour, Republican
- Springfield office: (217) 782-0066
- District office: (618) 665-4109
Source: U.S. Census Bureau, American Community Survey 5-year estimates, 2020–2024; towns and counties from the 2020 Census, 119th Congressional District and 2024 state legislative district tabulation. Figures rounded by us. Retrieved 2026-10-19. This product uses the Census Bureau Data API but is not endorsed or certified by the Census Bureau.
Source: U.S. Census Bureau, American Community Survey 5-year estimates, 2020–2024; towns and counties from the 2020 Census, 119th Congressional District and 2024 state legislative district tabulation. Figures rounded by us. Retrieved 2026-10-19. This product uses the Census Bureau Data API but is not endorsed or certified by the Census Bureau.