City in Vermilion County, Illinois
Danville
Who lives in Danville
Census survey estimates for 2020 to 2024, rounded.
People
- Population
- 28,600
- Median age
- 39.8 years
- Under 18
- 24%
- 65 and over
- 19%
- Veterans, of adults
- 6%
- Speak another language at home
- 7%
Race and ethnicity
- Hispanic or Latino, of any race
- 8%
- White, not Hispanic
- 54%
- Black, not Hispanic
- 34%
- Asian, not Hispanic
- 1%
Income and housing
- Median household income
- $46,000
- Below the poverty line
- 25%
- Bachelor's or higher, adults 25+
- 19%
- Owner-occupied homes
- 57%
- Median home value
- $79,000
2024 vote for president
- Kamala Harris, Democrat
- 49.8%
- Donald Trump, Republican
- 48.1%
- Other candidates
- 2.1%
Votes counted by the city's own election authority, by precinct. Source: MIT Election Data and Science Lab, precinct returns (public domain).
Who represents Danville


Danville's districts
U.S. House District 2
All of Danville
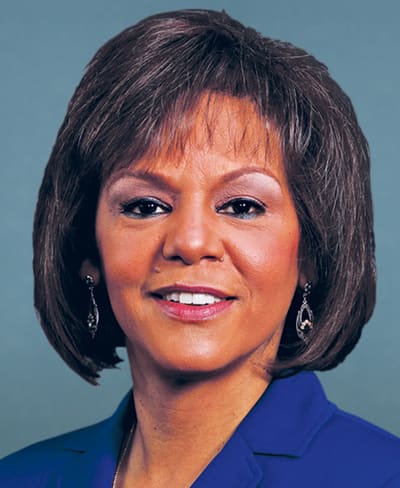
Held by Robin L. Kelly, Democratic
- Washington office: (202) 225-0773
About 742,600 people, median household income $64,300.
Largest towns: Chicago (part), Calumet City, Danville and 118 more
Illinois Senate District 52
All of Danville
Held by Paul Faraci, Democratic
- Springfield office: (217) 782-2507
- District office: (217) 355-5252
Illinois House District 104
All of Danville
Held by Brandun Schweizer, Republican
- Springfield office: (217) 782-4811
- District office: (217) 477-0104
Source: U.S. Census Bureau, American Community Survey 5-year estimates, 2020–2024; towns and counties from the 2020 Census, 119th Congressional District and 2024 state legislative district tabulation. Figures rounded by us. Retrieved 2026-10-19. This product uses the Census Bureau Data API but is not endorsed or certified by the Census Bureau.
Source: U.S. Census Bureau, American Community Survey 5-year estimates, 2020–2024; towns and counties from the 2020 Census, 119th Congressional District and 2024 state legislative district tabulation. Figures rounded by us. Retrieved 2026-10-19. This product uses the Census Bureau Data API but is not endorsed or certified by the Census Bureau.