Village in Cook County and Lake County, Illinois
Buffalo Grove
District lines run through Buffalo Grove, so who represents you here depends on your street. Search your address to see yours.
Who lives in Buffalo Grove
Census survey estimates for 2020 to 2024, rounded.
People
- Population
- 42,900
- Median age
- 42.0 years
- Under 18
- 25%
- 65 and over
- 16%
- Veterans, of adults
- 3%
- Speak another language at home
- 45%
Race and ethnicity
- Hispanic or Latino, of any race
- 6%
- White, not Hispanic
- 58%
- Black, not Hispanic
- 3%
- Asian, not Hispanic
- 30%
Income and housing
- Median household income
- $129,400
- Below the poverty line
- 7%
- Bachelor's or higher, adults 25+
- 69%
- Owner-occupied homes
- 80%
- Median home value
- $412,000
2024 vote for president
Not counted for Buffalo Grove on its own: its precincts follow township lines, not the town’s. See the figures for Cook County and Lake County.
Represent all of Buffalo Grove
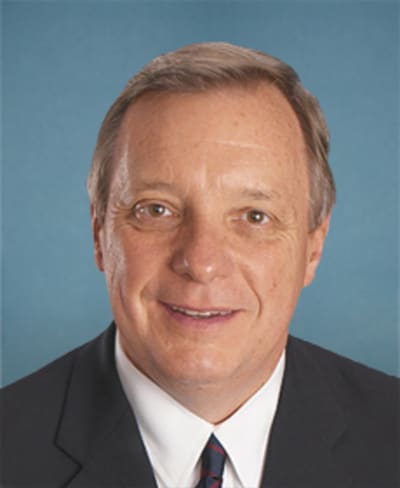
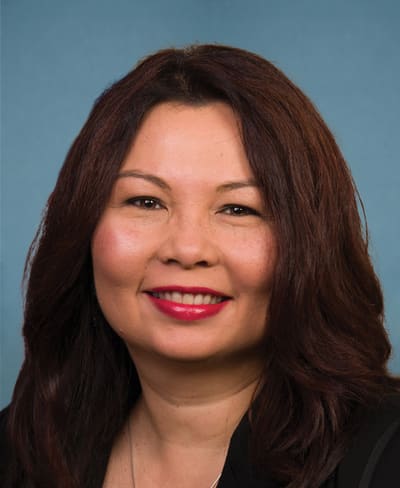
Represent part of Buffalo Grove
Each represents the part of Buffalo Grove inside their district. Under each is how many people lived in that part at the 2020 Census, of 43,212 in all.
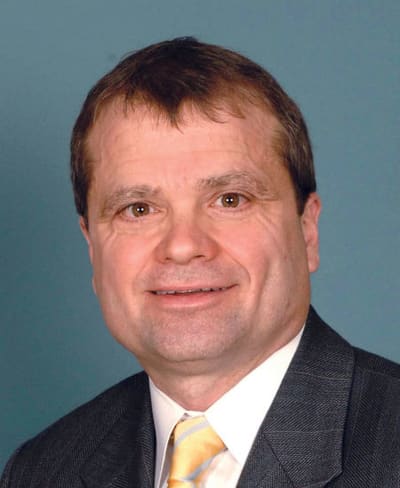 Mike QuigleyU.S. Representative, District 5, Democratic2,406 people in this part
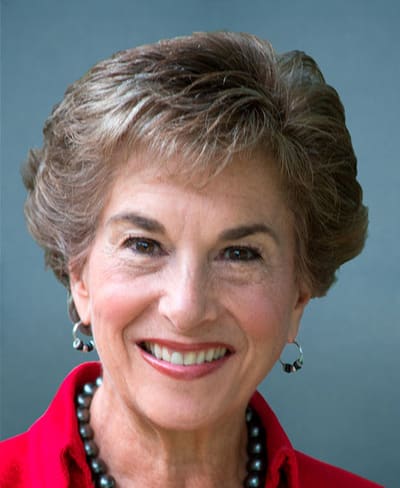 Janice D. SchakowskyU.S. Representative, District 9, Democratic21,929 people in this part
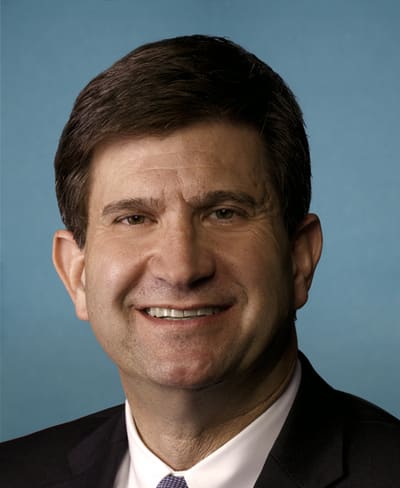 Bradley Scott SchneiderU.S. Representative, District 10, Democratic18,877 people in this part
- DHDarby HillsState Senator, District 26, Republican203 people in this part
- MWMark WalkerState Senator, District 27, Democratic9,563 people in this part
- JMJulie MorrisonState Senator, District 29, Democratic4,381 people in this part
- AJAdriane JohnsonState Senator, District 30, Democratic29,065 people in this part
- NSNabeela SyedState Representative, District 51, Democratic203 people in this part
- MCMary Beth CantyState Representative, District 54, Democratic9,563 people in this part
- TMTracy Katz MuhlState Representative, District 57, Democratic4,381 people in this part
- DDDan DidechState Representative, District 59, Democratic29,065 people in this part
Buffalo Grove's districts (11)
U.S. House (3)
- U.S. House District 5
Held by Mike Quigley, Democratic
Part of Buffalo Grove: 2,406 people in 2020
- U.S. House District 9
Held by Janice D. Schakowsky, Democratic
Part of Buffalo Grove: 21,929 people in 2020
- U.S. House District 10
Held by Bradley Scott Schneider, Democratic
Part of Buffalo Grove: 18,877 people in 2020
Illinois Senate (4)
- Illinois Senate District 26
Held by Darby Hills, Republican
Part of Buffalo Grove: 203 people in 2020
- Illinois Senate District 27
Held by Mark Walker, Democratic
Part of Buffalo Grove: 9,563 people in 2020
- Illinois Senate District 29
Held by Julie Morrison, Democratic
Part of Buffalo Grove: 4,381 people in 2020
- Illinois Senate District 30
Held by Adriane Johnson, Democratic
Part of Buffalo Grove: 29,065 people in 2020
Illinois House (4)
- Illinois House District 51
Held by Nabeela Syed, Democratic
Part of Buffalo Grove: 203 people in 2020
- Illinois House District 54
Held by Mary Beth Canty, Democratic
Part of Buffalo Grove: 9,563 people in 2020
- Illinois House District 57
Held by Tracy Katz Muhl, Democratic
Part of Buffalo Grove: 4,381 people in 2020
- Illinois House District 59
Held by Dan Didech, Democratic
Part of Buffalo Grove: 29,065 people in 2020
Source: U.S. Census Bureau, American Community Survey 5-year estimates, 2020–2024; towns and counties from the 2020 Census, 119th Congressional District and 2024 state legislative district tabulation. Figures rounded by us. Retrieved 2026-10-19. This product uses the Census Bureau Data API but is not endorsed or certified by the Census Bureau.