County in Illinois
St. Clair County
About 253,700 people, median household income $73,900.
District lines run through St. Clair County, so who represents you here depends on where you live. Search your address to see yours.
Who lives in St. Clair County
Census survey estimates for 2020 to 2024, rounded.
People
- Population
- 253,700
- Median age
- 39.9 years
- Under 18
- 23%
- 65 and over
- 17%
- Veterans, of adults
- 12%
- Speak another language at home
- 5%
Race and ethnicity
- Hispanic or Latino, of any race
- 5%
- White, not Hispanic
- 59%
- Black, not Hispanic
- 28%
- Asian, not Hispanic
- 2%
Income and housing
- Median household income
- $73,900
- Below the poverty line
- 14%
- Bachelor's or higher, adults 25+
- 32%
- Owner-occupied homes
- 68%
- Median home value
- $180,000
2024 vote for president
- Kamala Harris, Democrat
- 52.9%
- Donald Trump, Republican
- 45.0%
- Other candidates
- 2.1%
Votes counted, by precinct. Source: MIT Election Data and Science Lab, precinct returns (public domain).
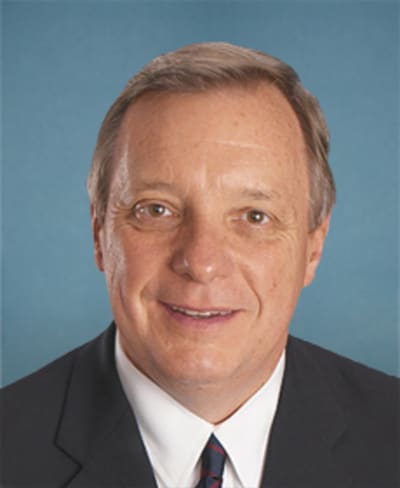
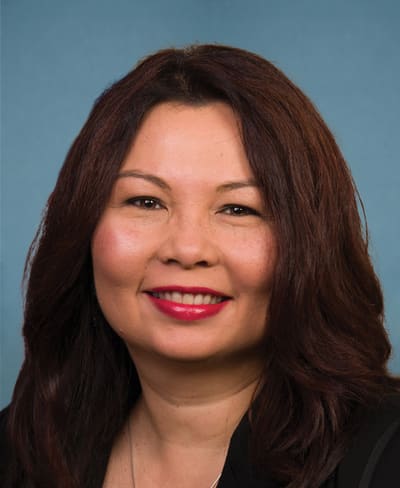
Represent all of St. Clair County
St. Clair County's districts (11)
U.S. House (2)
- U.S. House District 12
Held by Mike Bost, Republican
Part of St. Clair County: 93,124 people in 2020
- U.S. House District 13
Held by Nikki Budzinski, Democratic
Part of St. Clair County: 164,276 people in 2020
Illinois Senate (4)
- Illinois Senate District 55
Held by Jason Plummer, Republican
Part of St. Clair County: 6,548 people in 2020
- Illinois Senate District 56
Held by Erica Harriss, Republican
Part of St. Clair County: 35,045 people in 2020
- Illinois Senate District 57
Held by Christopher Belt, Democratic
Part of St. Clair County: 212,589 people in 2020
- Illinois Senate District 58
Held by Terri Bryant, Republican
Part of St. Clair County: 3,218 people in 2020
Illinois House (5)
- Illinois House District 109
Held by Charlie Meier, Republican
Part of St. Clair County: 6,548 people in 2020
- Illinois House District 112
Held by Katie Stuart, Democratic
Part of St. Clair County: 35,045 people in 2020
- Illinois House District 113
Held by Jay Hoffman, Democratic
Part of St. Clair County: 104,205 people in 2020
- Illinois House District 114
Held by Kevin Schmidt, Republican
Part of St. Clair County: 108,384 people in 2020
- Illinois House District 115
Held by David Friess, Republican
Part of St. Clair County: 3,218 people in 2020
Towns (37)
Cities, villages and unincorporated communities, with the number of people in the county’s part of each at the 2020 Census.
- Belleville42,404
- O'Fallon32,289
- East St. Louis18,469
- Fairview Heights16,706
- Swansea14,386
- Shiloh14,098
- Cahokia12,096
- Mascoutah8,754
- Lebanon4,691
- Freeburg4,582
- Caseyville4,400
- Centreville4,232
- Millstadt4,071
- Smithton4,006
- Dupo (part)3,990
- Scott AFB3,688
- Collinsville (part)2,708
- Washington Park2,592
- Fairmont City (part)2,241
- New Athens1,955
- Marissa1,833
- Alorton1,566
- Brooklyn649
- St. Libory628
13 more towns
Source: U.S. Census Bureau, American Community Survey 5-year estimates, 2020–2024; towns and counties from the 2020 Census, Demographic and Housing Characteristics. Figures rounded by us. Retrieved 2026-10-19. This product uses the Census Bureau Data API but is not endorsed or certified by the Census Bureau.